The Project
We worked on tumor detection for breast pathology and verify our model's performance with real clinical data. We aimed to accurately identify tumor areas within pathological tissue slides by using deep learning, particularly neural networks. Pathologic tissue slides vary greatly in the data due to differences in the staining process, types, and settings of scanners. Developing a deep learning model that shows consistent performance under various conditions has beem a long standing problem.
Our goal is to assist pathologists in making faster and more accurate diagnoses in clinical settings through trained models. To this end, we deploy our model in real clinical settings for patient diagnosis and treatment.
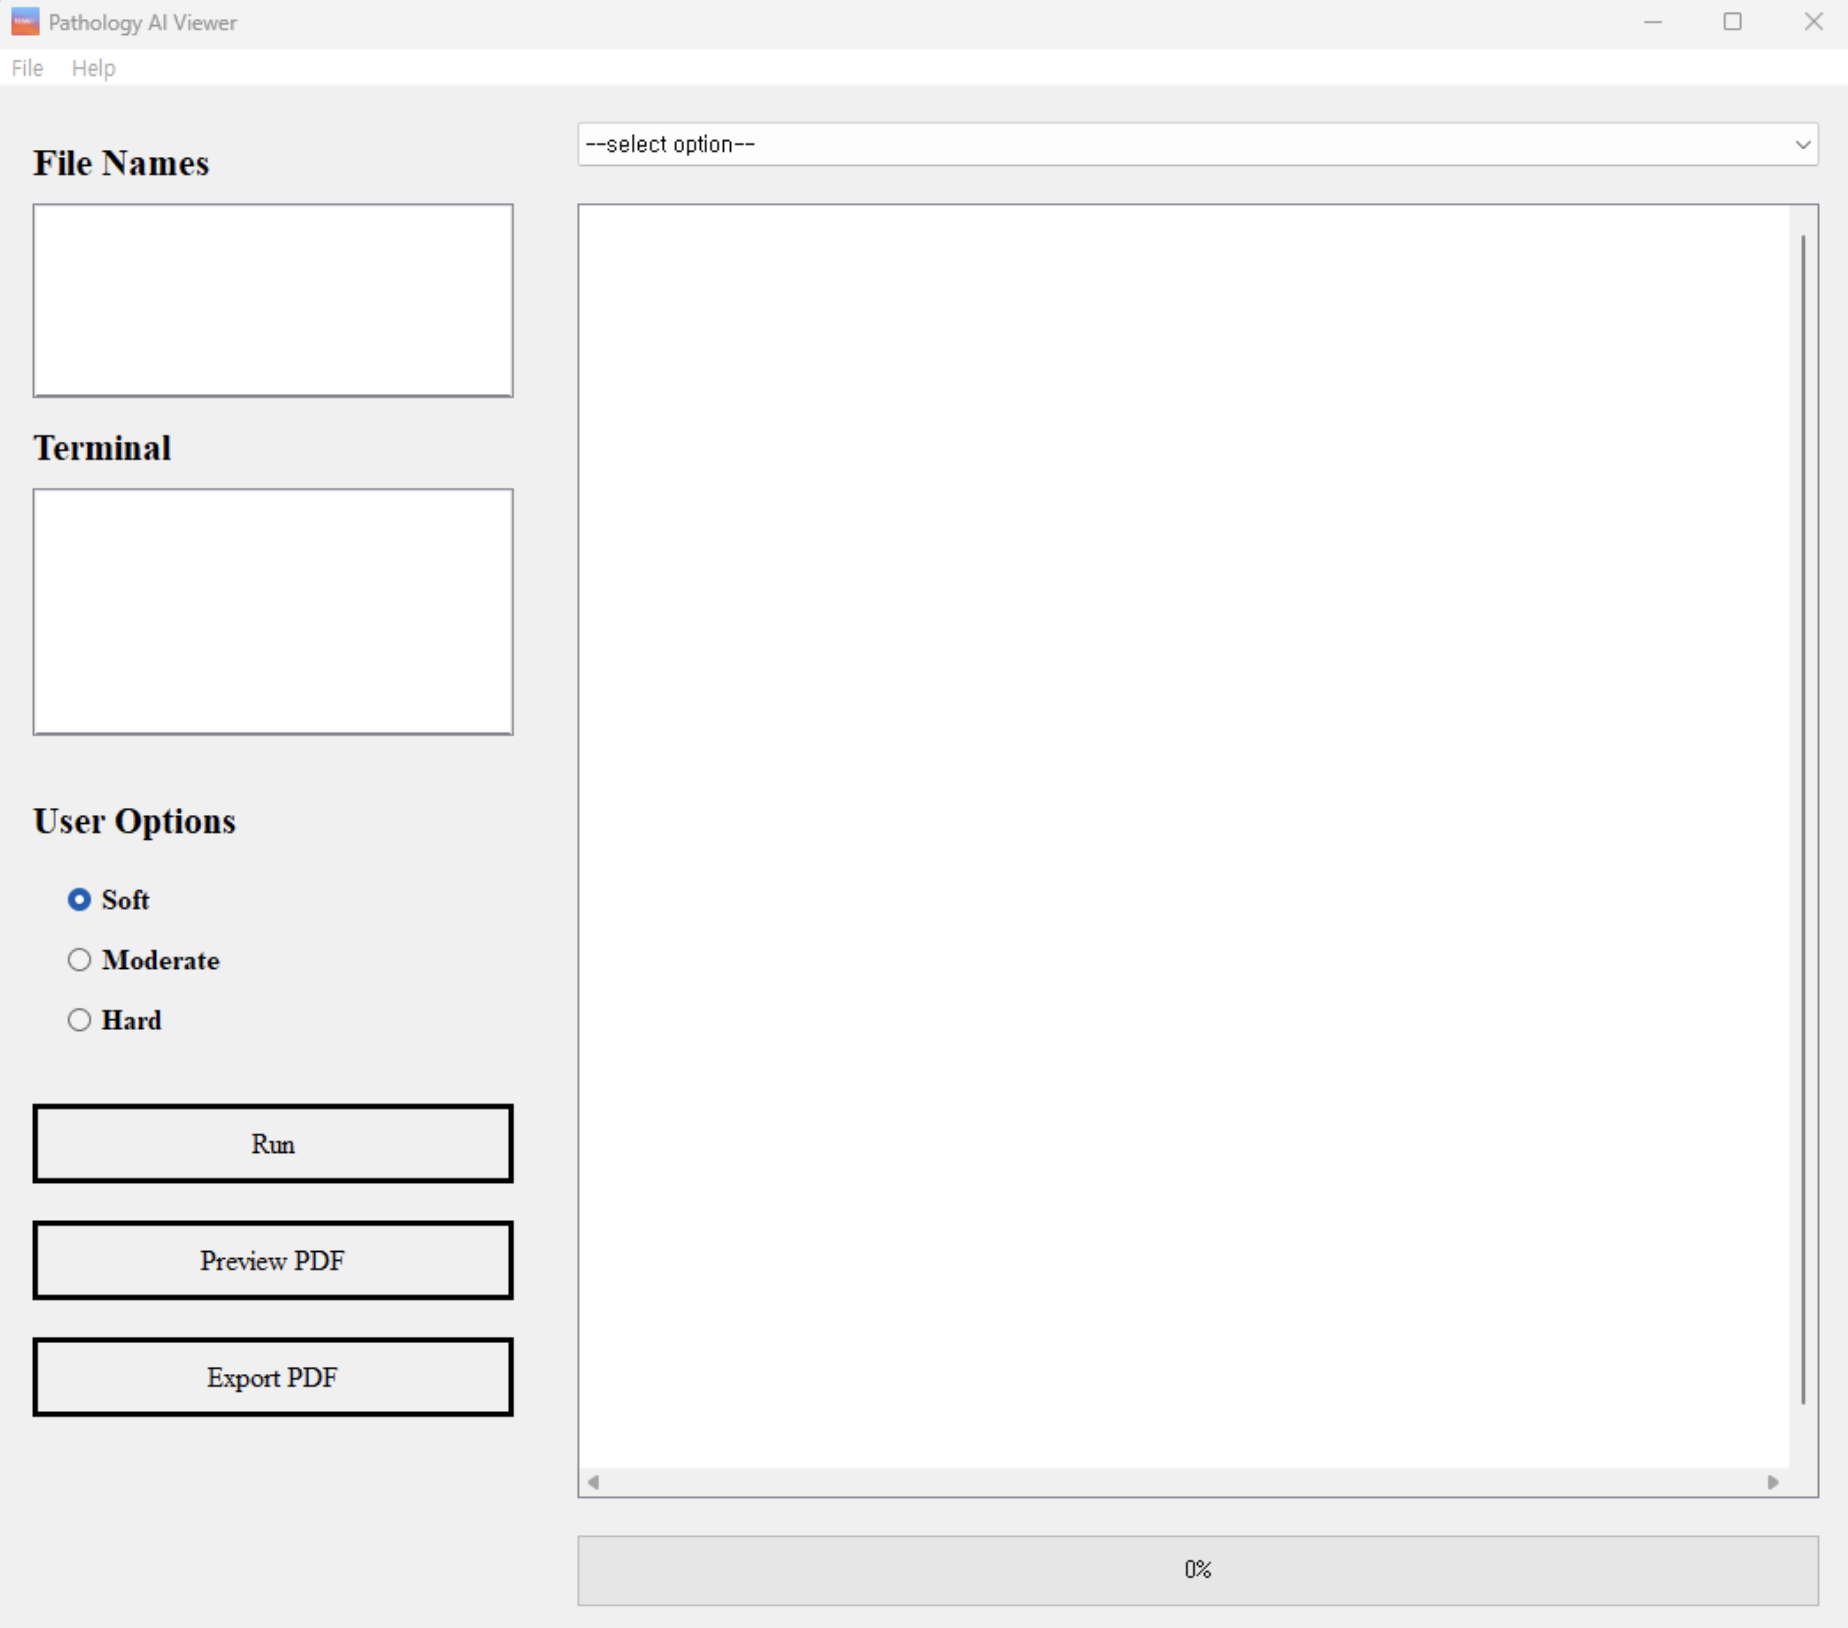
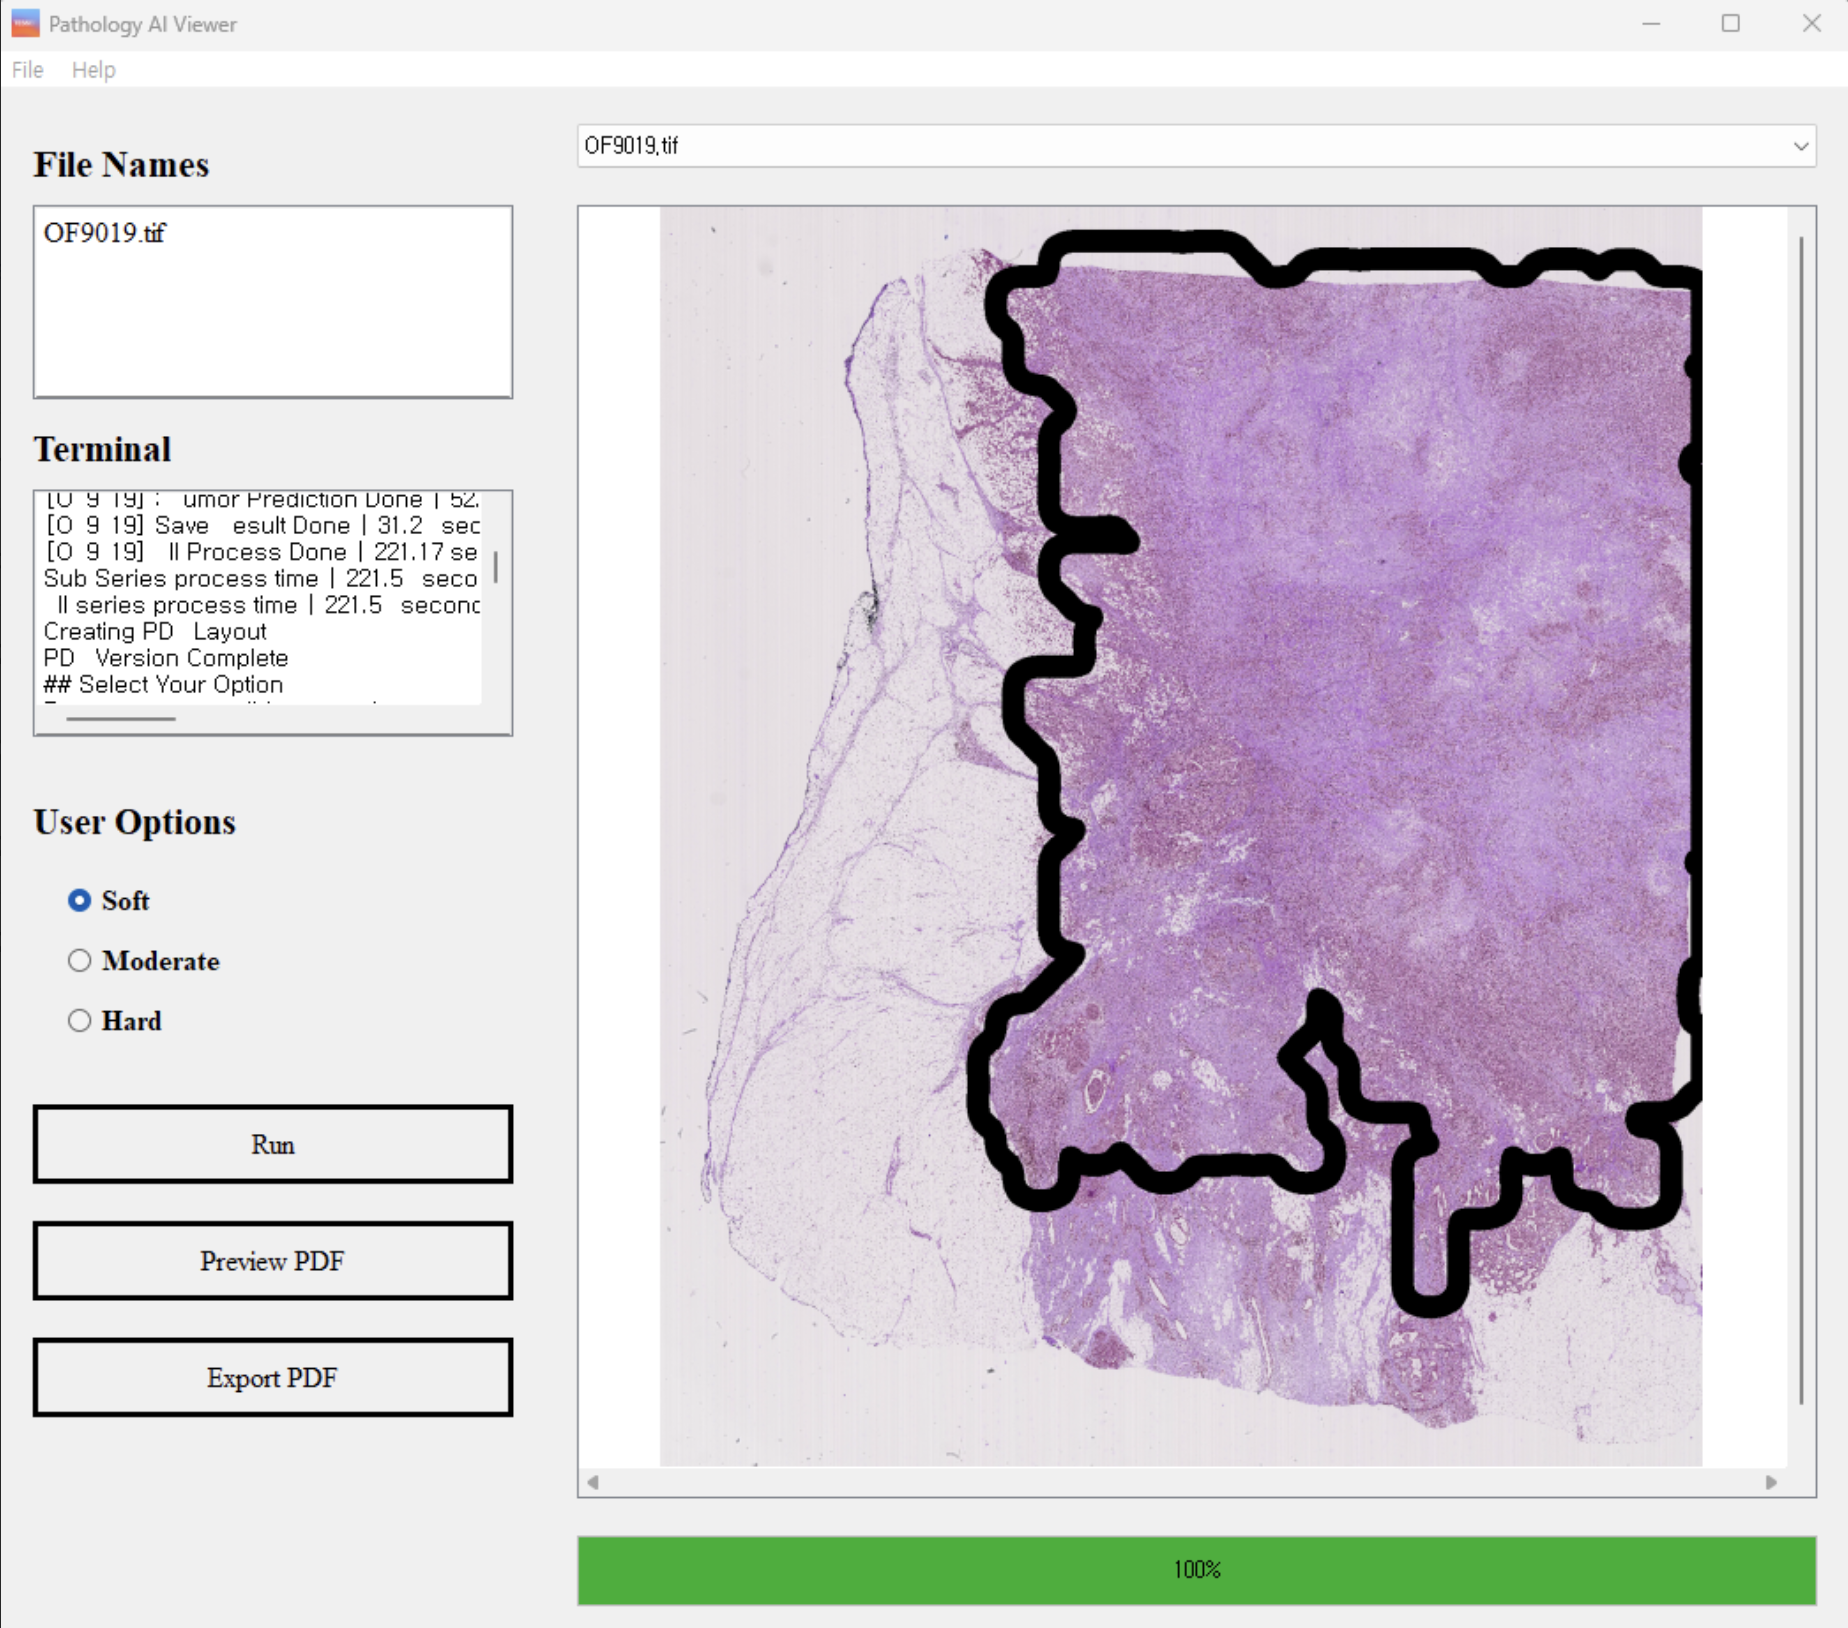
Our user-friendly graphical user interface (GUI) facilitates the use of our trained models by pathologists in clinical settings. As shown in Figure 1 and 2, our GUI is designed to allow pathologists to analyze data and interpret results thus enhancing the accuracy and efficiency of pathological analysis and simplifying the diagnostic process.
Background
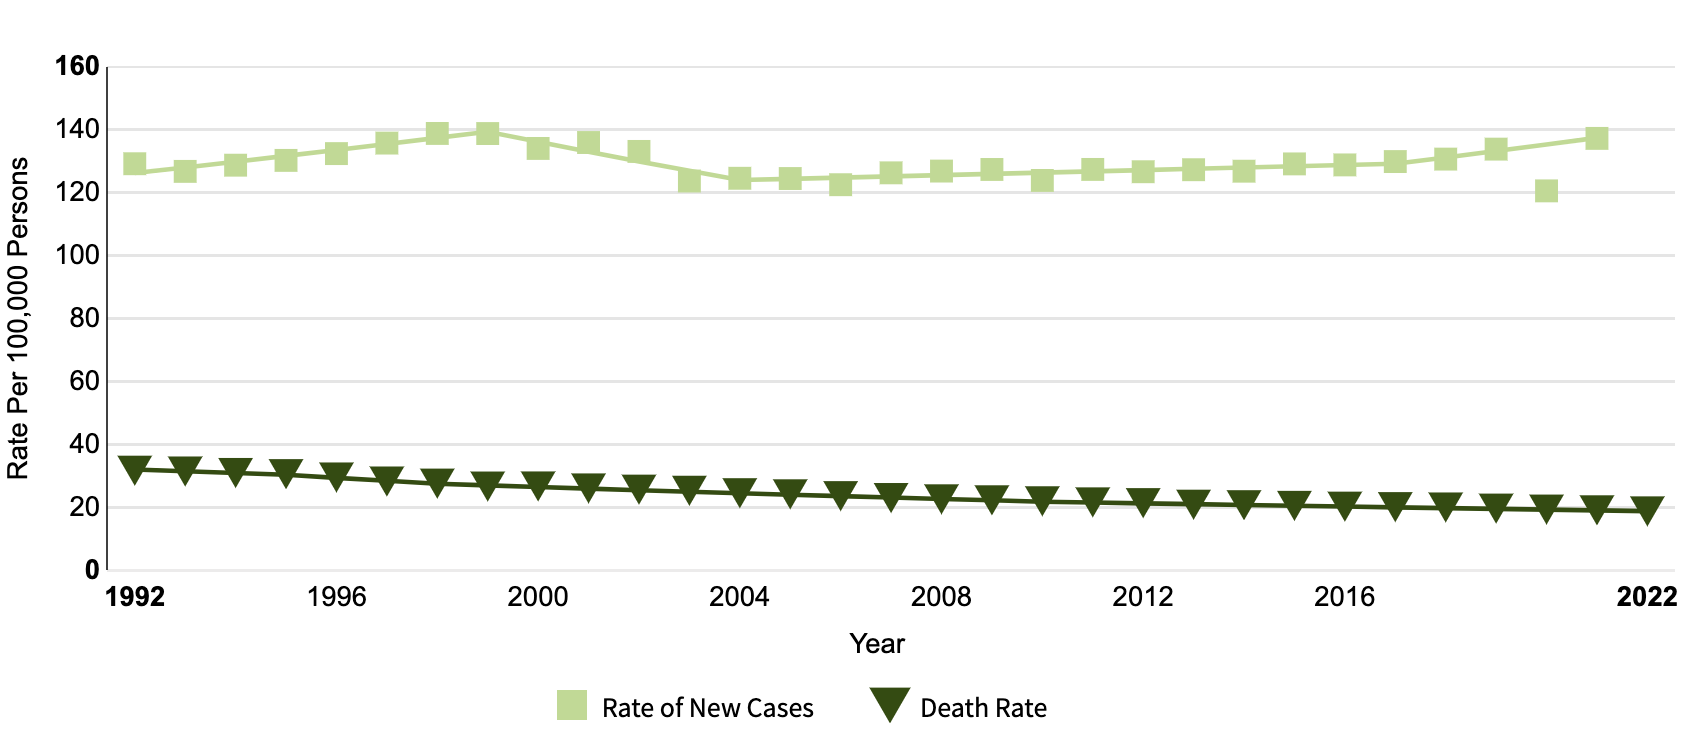
According to the National Cancer Institute, Breast cancer is more than 15% of all new reported cancer cases (see Figure 3). Early diagnosis and the development of effective treatment methods can prevent deaths, and pathological analysis plays a pivotal role in diagnosis and treatment of breast cancer. The diagnosis is primarily done through pathologic tissue slide analysis, and information from the analysis is used to evaluate the nature and stage of the tumor. In recent years, deep learning has made significant advances in the field of medical image analysis. With state of the art deep learning models, scientists can detect and analyze cancer cells on pathological tissue slides, in the form of whole slide images.
The main challenge in tumor diagnosis using trained models is generalizing their performance across the diverse nature of pathological tissue slide data. Thus, we focused on designing and optimizing robust models taking this diversity into account.
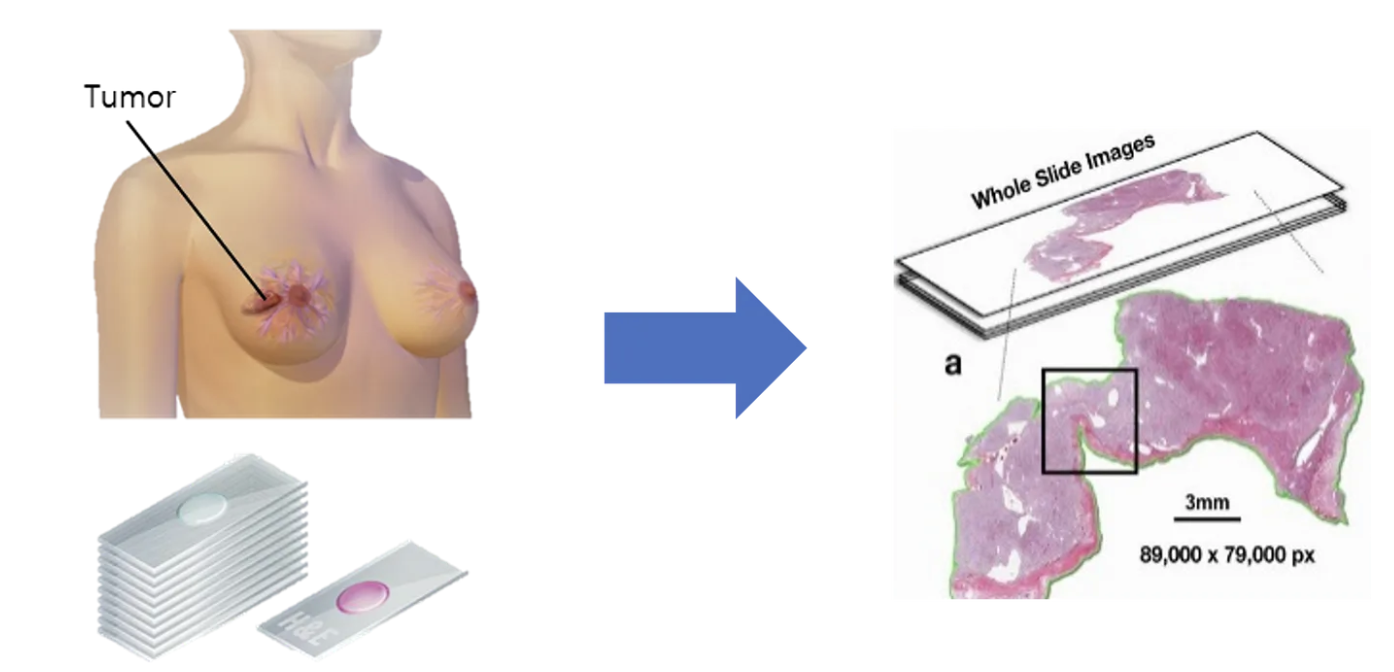
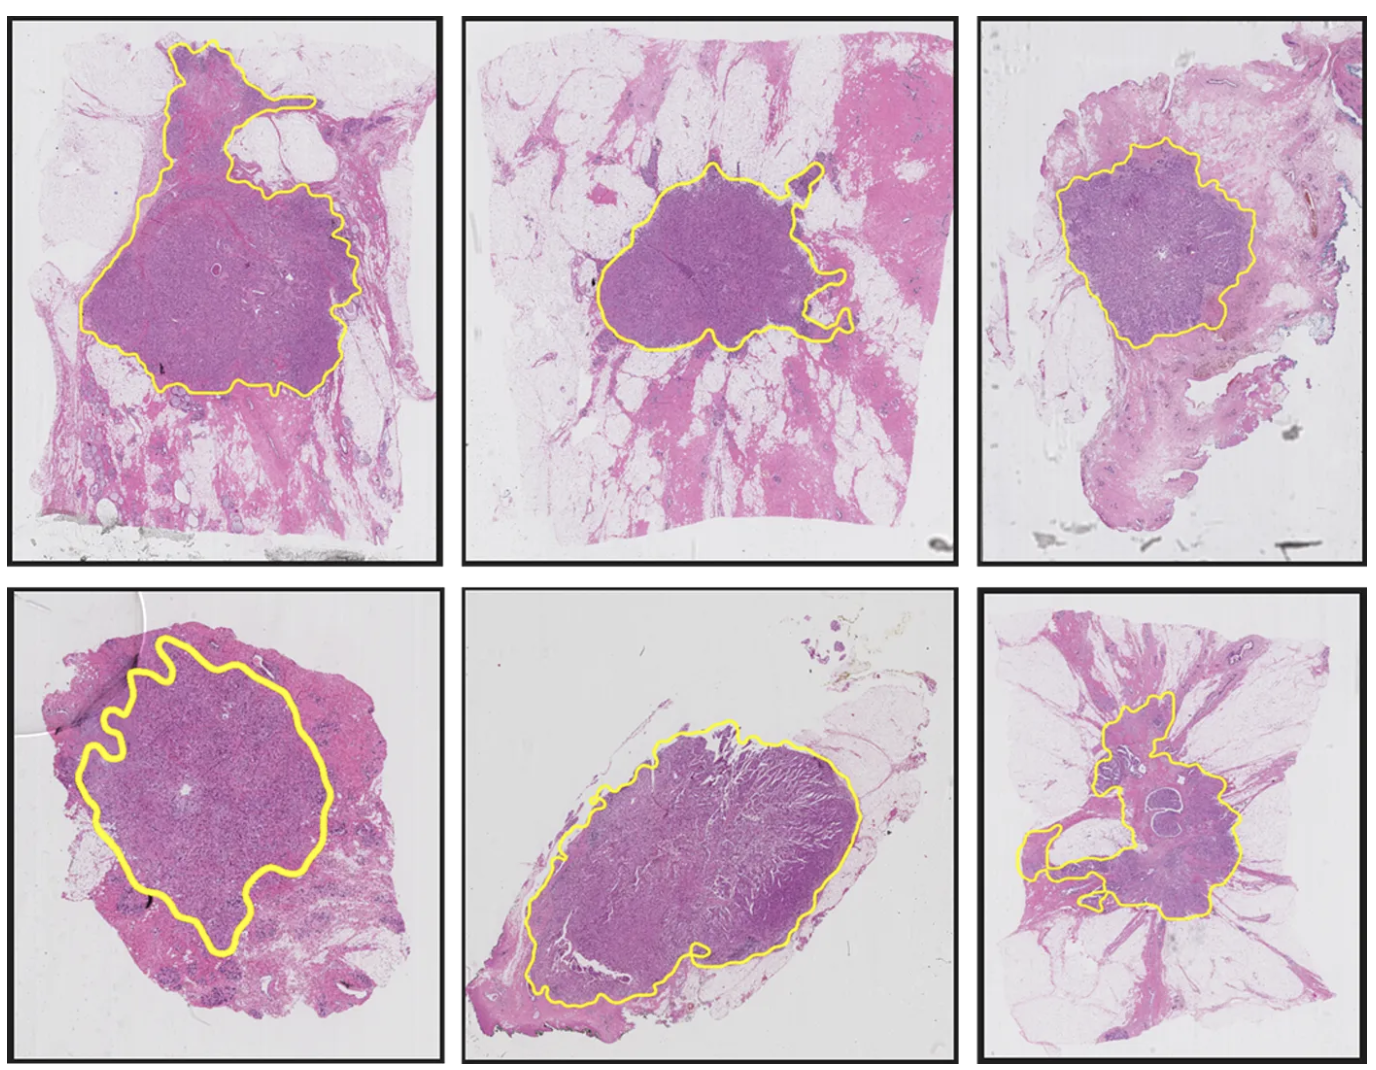
Breast Pathology Tissue Slide Data (whole slide image) is a tissue sample that is pathologically examined for the diagnosis of breast cancer as shown in Figure 4. The sample is finely cut and placed on a glass slide, allowing the staining process to distinguish between cancer cells and normal cells.
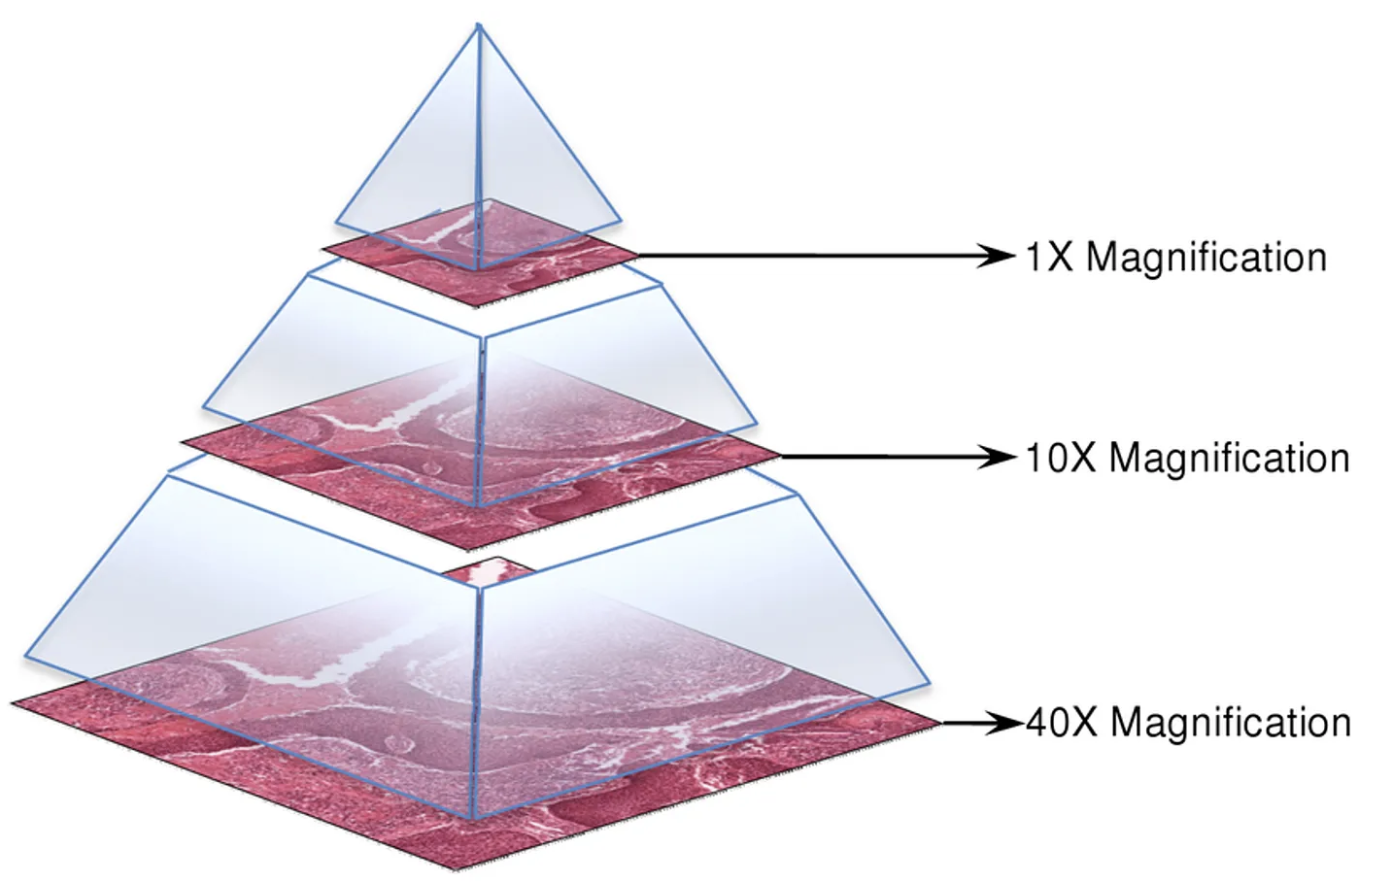
Tissue slides are converted into digital images, where the characteristics of the data are revealed. Digital slides have a pyramid structure that includes various magnification levels, allowing for detailed analysis of high-resolution in smaller areas. This data is used to determine the type, size, and growth pattern of breast cancer.
Types of Breast Cancer
There are many different types of breast cancer that can be identified on the breast histopathology slide. The main types include IDC (Invasive Ductal Carcinoma), DCIS (Ductal Carcinoma In Situ), ILC (Invasive Lobular Carcinoma), and LCIS (Lobular Carcinoma In Situ). IDC and ILC are invasive forms of breast cancer, while DCIS and LCIS are non-invasive.
Our goal is clinical deployment, prioritizing a rapid assessment of breast cancer presence and location. Once our model confirms the existence of a tumor, further medical examinations will be conducted. Therefore, we focused on developing a model that identifies tumor regions without distinguishing specific types.
Method
The following steps outline our approach:
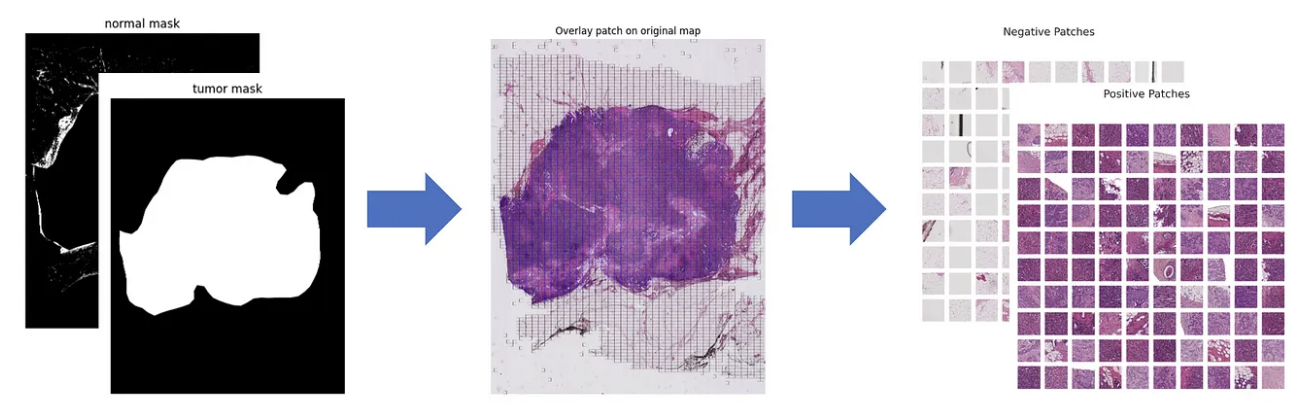
- Patch Extraction: We applied a sliding window method to divide whole slide images (WSI) into smaller patches. Each WSI (3000×4000) was split into 256×256 patches, making them suitable for neural network processing (Figure 6).
- Model Selection & Training: We trained multiple neural network architectures (e.g., VGG, Inception, UNet, Swin Transformer) using our annotated dataset, which was pre-annotated by a professional pathologist.
- Evaluation: We assessed model performance based on F1 score and accuracy.
A significant challenge was class imbalance, as non-tumor patches vastly outnumbered tumor patches. To address this, we controlled the tumor-to-non-tumor patch ratio during training. Additionally, data augmentation played a key role in mitigating multiple issues:
- Color jittering and noise augmentation addressed variations in staining methods.
- Targeted augmentation was applied specifically to tumor patches to improve model generalization.
We conducted five model tests using 5-fold cross-validation to enhance model robustness. A hyperparameter tuning process was implemented to optimize performance and prevent overfitting. The model was also evaluated on an external dataset, achieving consistently high accuracy across all folds:
- Fold 0: 0.9532
- Fold 1: 0.9518
- Fold 2: 0.9513
- Fold 3: 0.9506
- Fold 4: 0.9498
With an average F1 score exceeding 0.95, our model demonstrates strong performance and consistency.
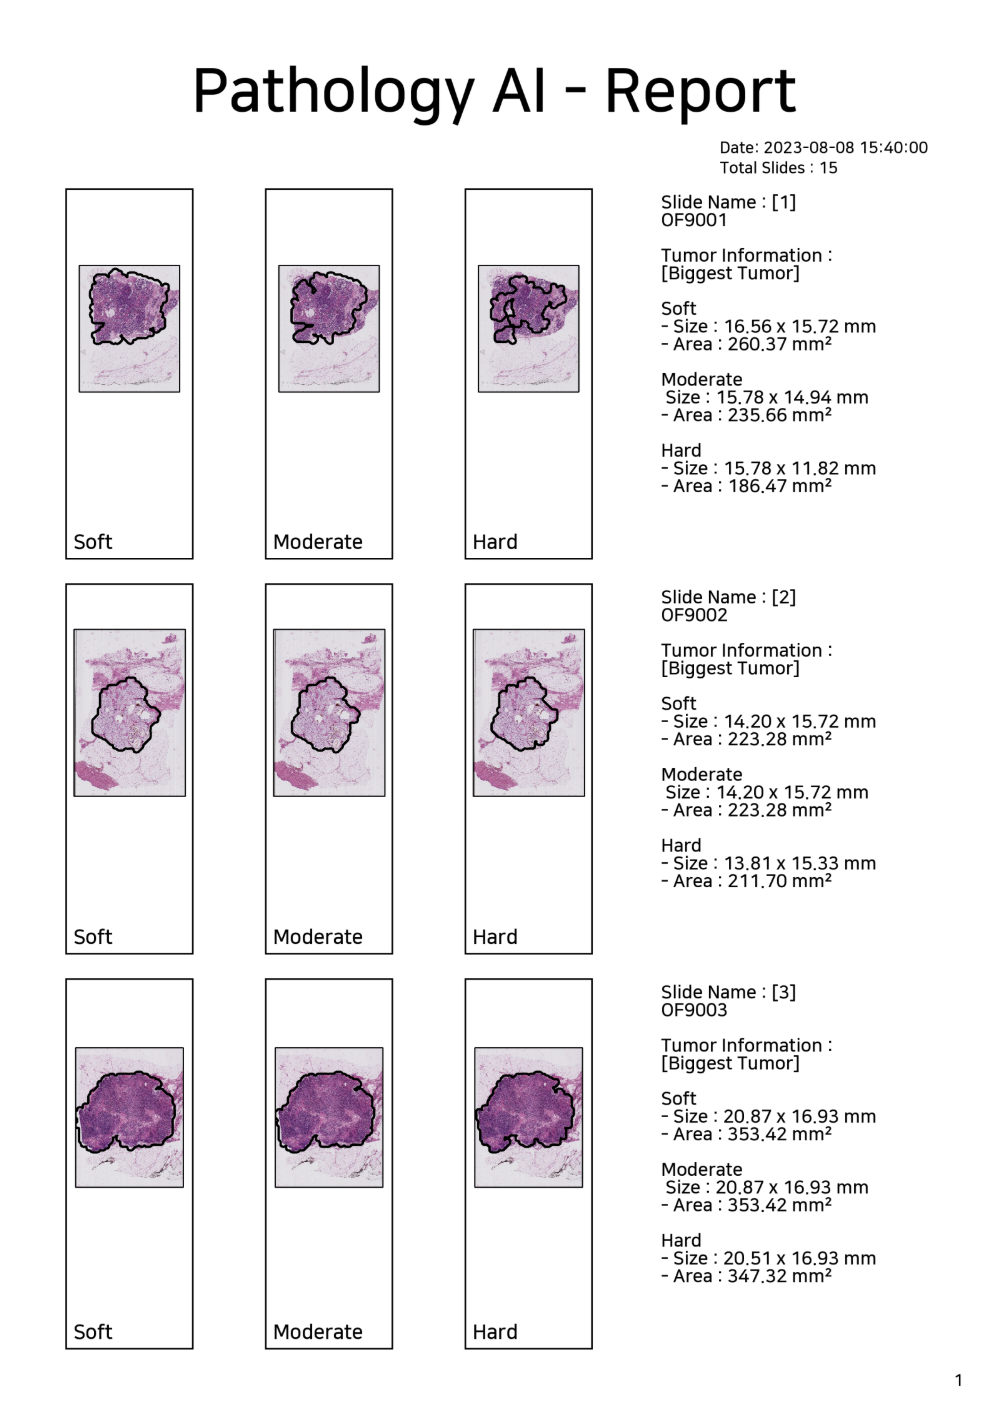
Additionally, our GUI features a Tumor Confidence Control option, allowing users to adjust the sensitivity of tumor detection:
- Soft: Displays tumor regions with ≥50% confidence
- Moderate: Displays tumor regions with ≥70% confidence
- Hard: Displays tumor regions with ≥90% confidence
Furthermore, users can generate detailed analysis reports and data sheets (Figure 8) based on tumor inference results, enabling systematic documentation and easy sharing of diagnostic information.
Conclusion
We developed a neural network-based model and GUI program to increase the accuracy and efficiency of breast cancer diagnosis. Without a high-cost, high-resolution microscope, pathology slides can be analyzed quickly in a variety of clinical settings, not only increasing the efficiency of pathology testing, but also allowing large-scale data to be continuously built through quantitative measurements. This allows us to take a step closer to personalized medication and precision medication approaches in treatment decisions along with accurate prognosis predictions.